

- Marcus
Questions
8
Answers
24
-
The problem you faced was caused by a Windows internal setting when your system language is not English.
To fix it, please follow these steps:
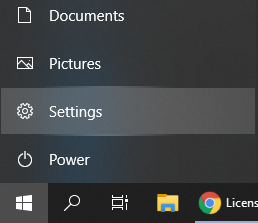
1. Please go to Windows’ Settings
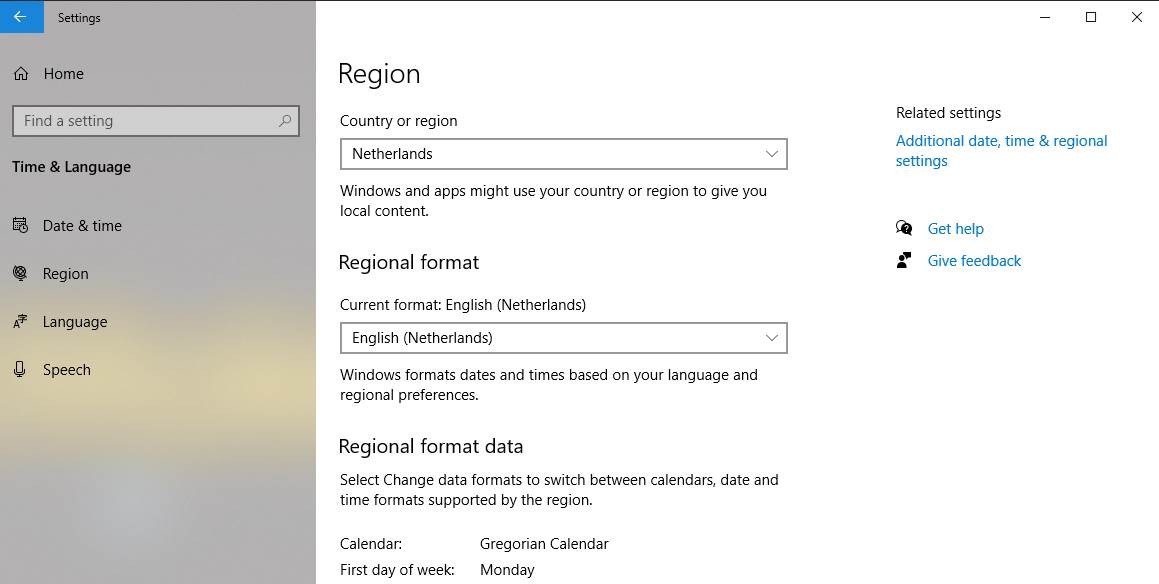
2.Find “Time and Language”, go to “Region” on the left, then click on “Additional date, time & regional settings” at the top-right corner:
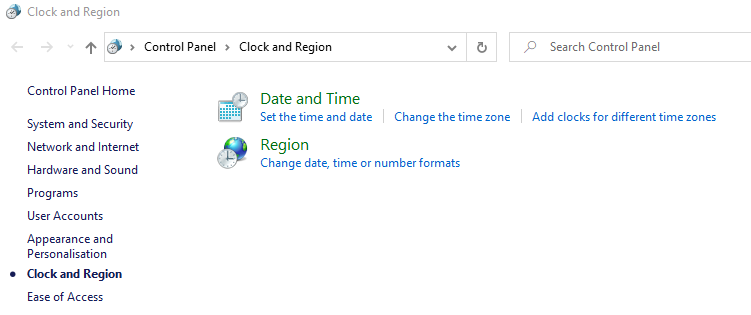
3.Click “Change date, time or number formats”
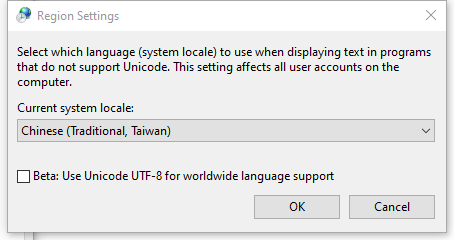
4.Switch to “Administrative” tab. Click “Change system locale…”
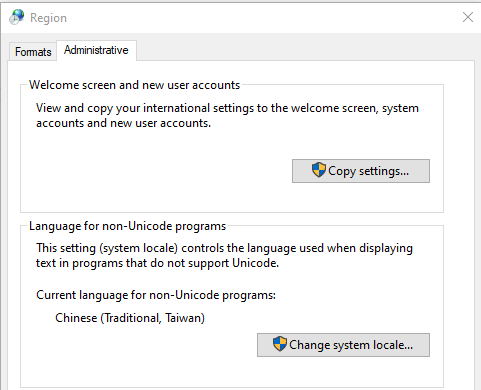
5.Please uncheck “Beta: Use Unicode UTF-8 for worldwide language support”.
P.S. You can keep it unchecked until you start to see that of your language’s characters are not shown correctly.
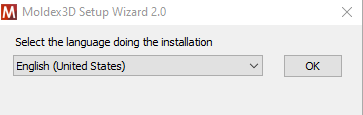
6.Then please run the installation program again (setup.exe), normally it should work and show you the following screen:
- 293 views
- 1 answers
- 0 votes
-
RE: What’s the difference between transient cooling (Ct F P Ct W) and process simulation (F/P/Ct/W)?
Hi Andre,
There is indeed a difference in solution accuracy between the two.
With FillPack Mode = 1, Fill and Pack are solved separately. In most cases, the flow behavior during the Pack stage is already almost negligible, so the focus is on pressure transmission. Since the packing time is usually much longer, enlarging the time step will not significantly affect the results.With FillPack Mode = 2, the Pack stage continues to be solved with the high time resolution of the Flow stage, which makes the analysis time longer. Therefore, this mode is only used when focusing on detailed analysis.
If you have specific requirements, please let us know and we can provide recommendations based on your case. Thank you.
- 1060 views
- 7 answers
- 0 votes
-
Hi Tim,
You can include non-linear characteristics in NX Nastran using MATS1, but Moldex3D alone won’t give you that. You’ll typically need a micromechanical model (like Digimat) to generate the non-linear anisotropic material data that can be plugged into MATS1.
- 499 views
- 1 answers
- 0 votes
-
Hi Michael,
- 599 views
- 1 answers
- 1 votes
-
This window mainly displays a progress bar for actions that take a relatively long time to complete.
“Update Molding Defect Results” primarily involves loading air trap and weld line results. This process usually doesn’t take much time and is only required the first time you switch to that group. Currently, it cannot be skipped.- 630 views
- 1 answers
- 0 votes
-
鎖模力的計算是考慮開模方向的壓力跟投影面積,因此側向滑塊的壓力就不會考慮到
但實際上常見的滑塊固定大多是透過楔塊鎖模機構,也就是來自於合模力的間接作用
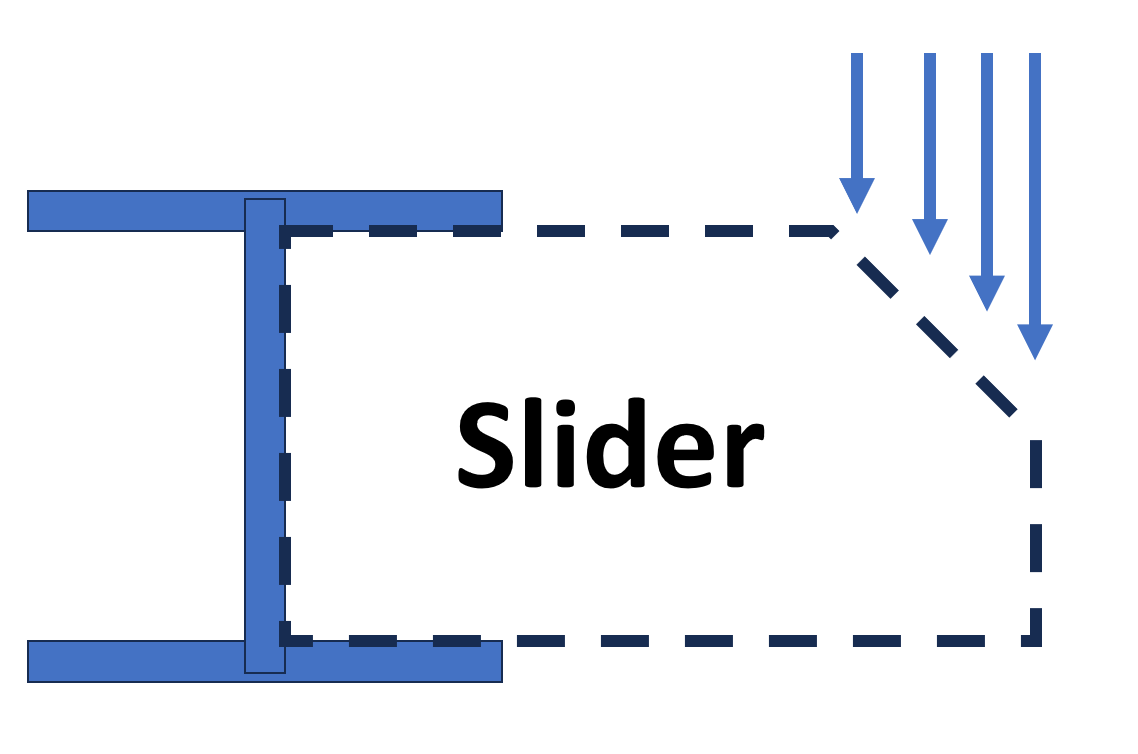
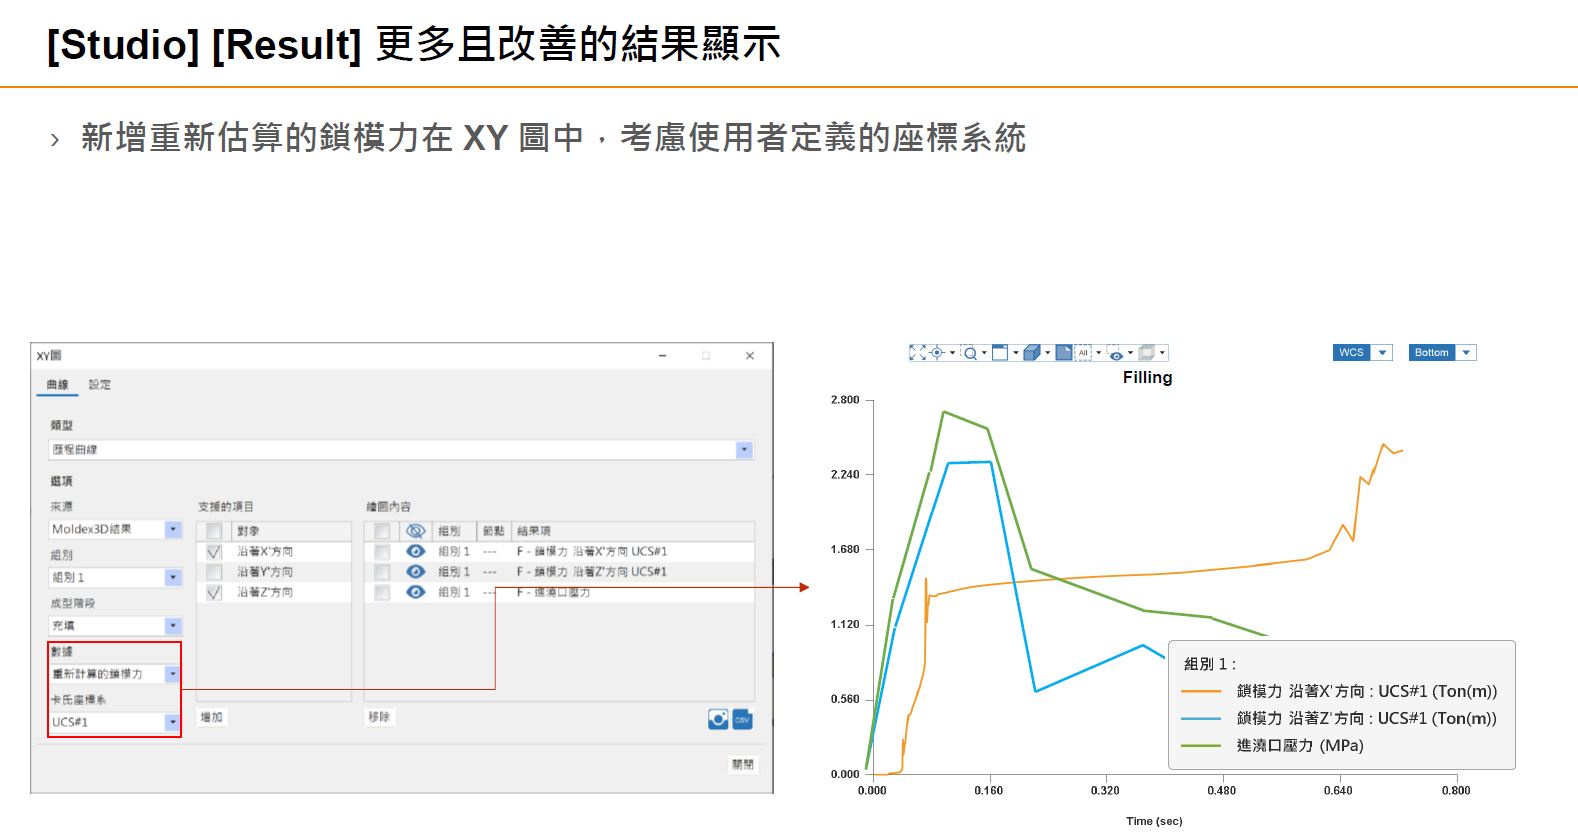
可以用2025的新功能 “重新計算的鎖模力”來計算側向的鎖模力,加總起來考量應該可以彌補這部分的誤差
- 612 views
- 2 answers
- 0 votes
-
Hi Felix,
I am Marcus from Moldex3D Technical Support. Based on the limited information provided, it is difficult for us to offer specific recommendations. It may be necessary to further review the material parameters and model. We recommend providing the project to your technical support representative for further investigation. Thank you.
- 560 views
- 3 answers
- 0 votes
-
Hi Andre,
I am Marcus from Moldex3D technical support. As you mentioned, D3 plays an important role in PC materials. However, D3 is not easy to measure, and the model has not been optimized yet, which can lead to pressure overestimation. As a result, there is no universal value available for use. Our R&D team is working on a new D3 model. If you are interested, please contact your Moldex3D representative.
Thank you.
- 536 views
- 1 answers
- 0 votes
-
Hi Felix,
The function behaves just as you described,
It act as a vertical line downward, meaning that only elements directly intersected by this line contribute to the plot
- 777 views
- 3 answers
- 0 votes
-
Hi Felix,
This is Marcus from Moldex3D Support. Please use thickness XY Plot.
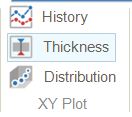
Add the fiber orientation in the X, Y, and Z directions for the desired probe.
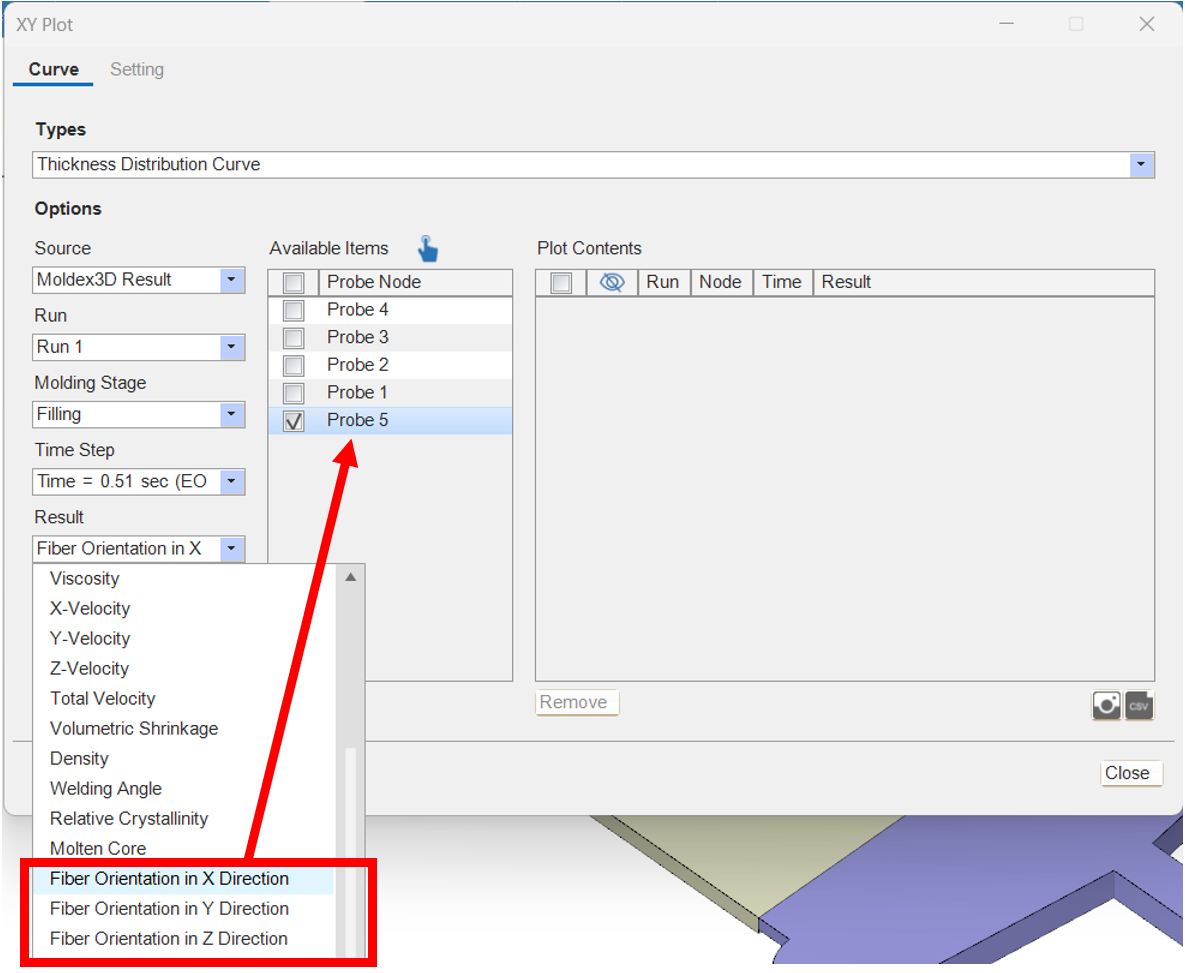
You should see the fiber orientation plot like the picture you attached.
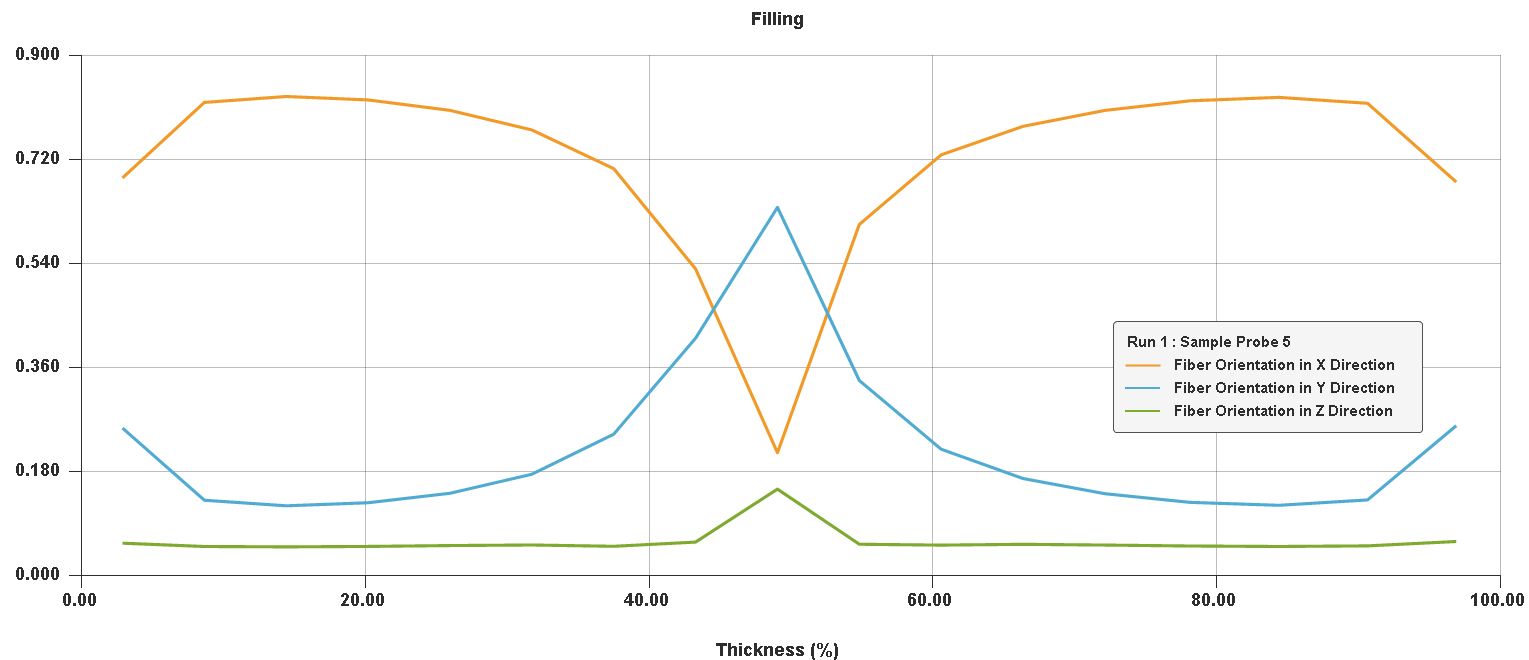
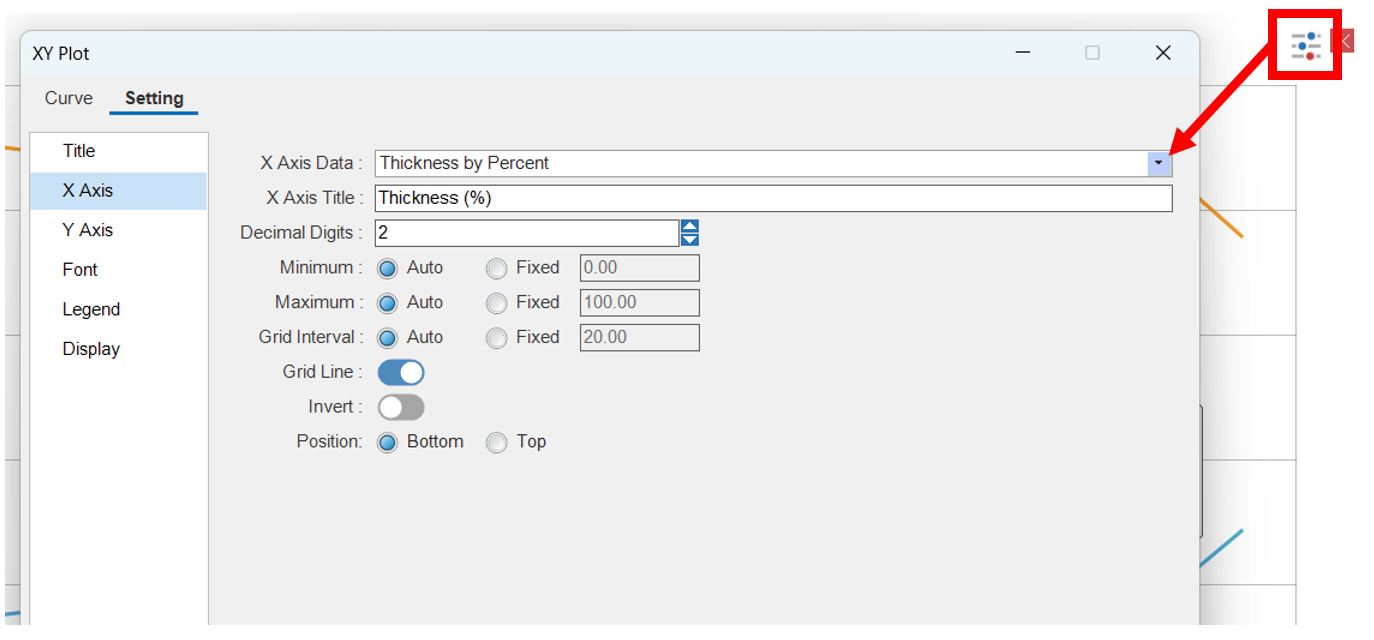
In addition, the plot setting can switch the X-axis between the percentage of thickness and the thickness in millimeters.
- 777 views
- 3 answers
- 0 votes


