RE: Plotting the fiber orientation distribution
Hello everyone,
I have simulated fiber orientation in Moldex3D and now I would like to export the fiber orientation data of a single slice. I’m particularly interested in obtaining a plot similar to the one shown in the Moldex3D promotional materials (see below). Alternatively, a representation with a normalized x-axis—as described in articles by Huan-Chang Tseng and colleagues—would also be ideal.
I have searched through the documentation and forums but couldn’t find clear instructions on how to extract this specific plot. For reference, I’m using Moldex3D version 2023.
Any help or pointers on how to achieve this export would be greatly appreciated.
Thank you in advance!
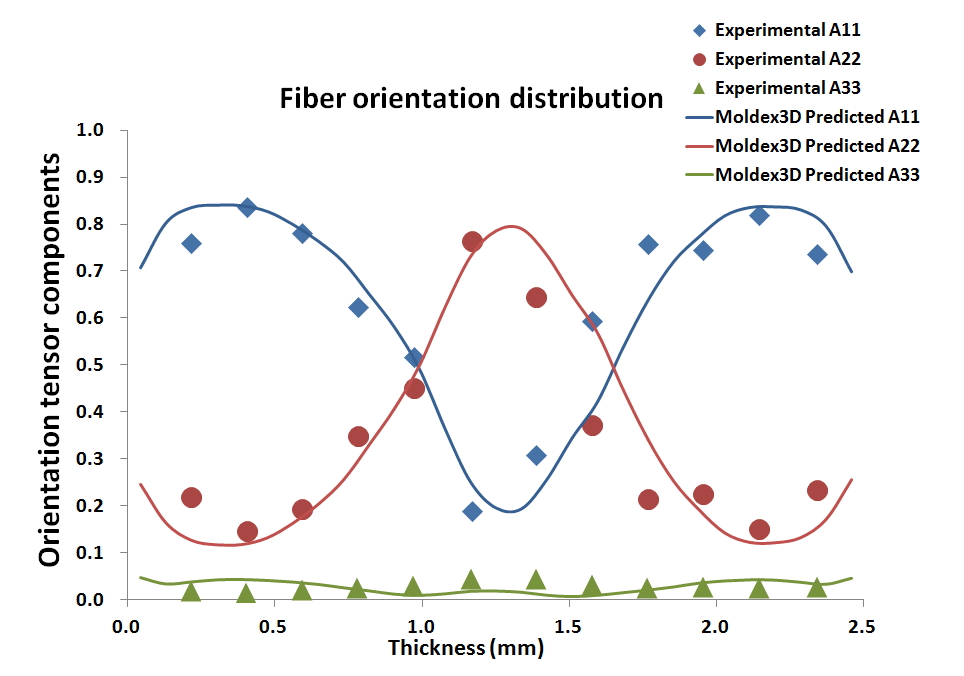 Fiber orientation plot from: https://www.moldex3d.com/wp-content/uploads/2017/03/Fiber005.jpg

Hi Felix,
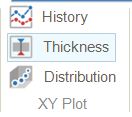
This is Marcus from Moldex3D Support. Please use thickness XY Plot.
Add the fiber orientation in the X, Y, and Z directions for the desired probe.
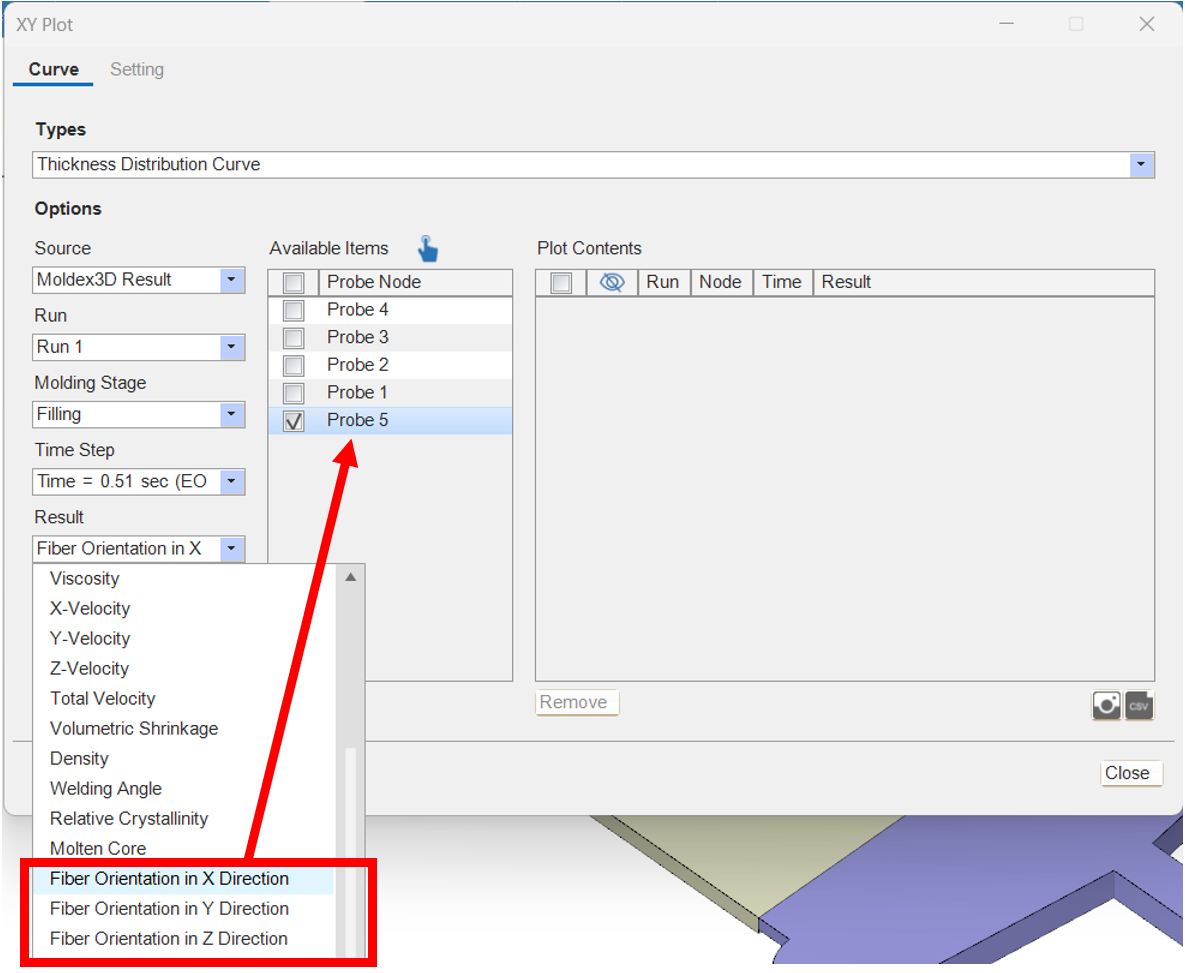
You should see the fiber orientation plot like the picture you attached.
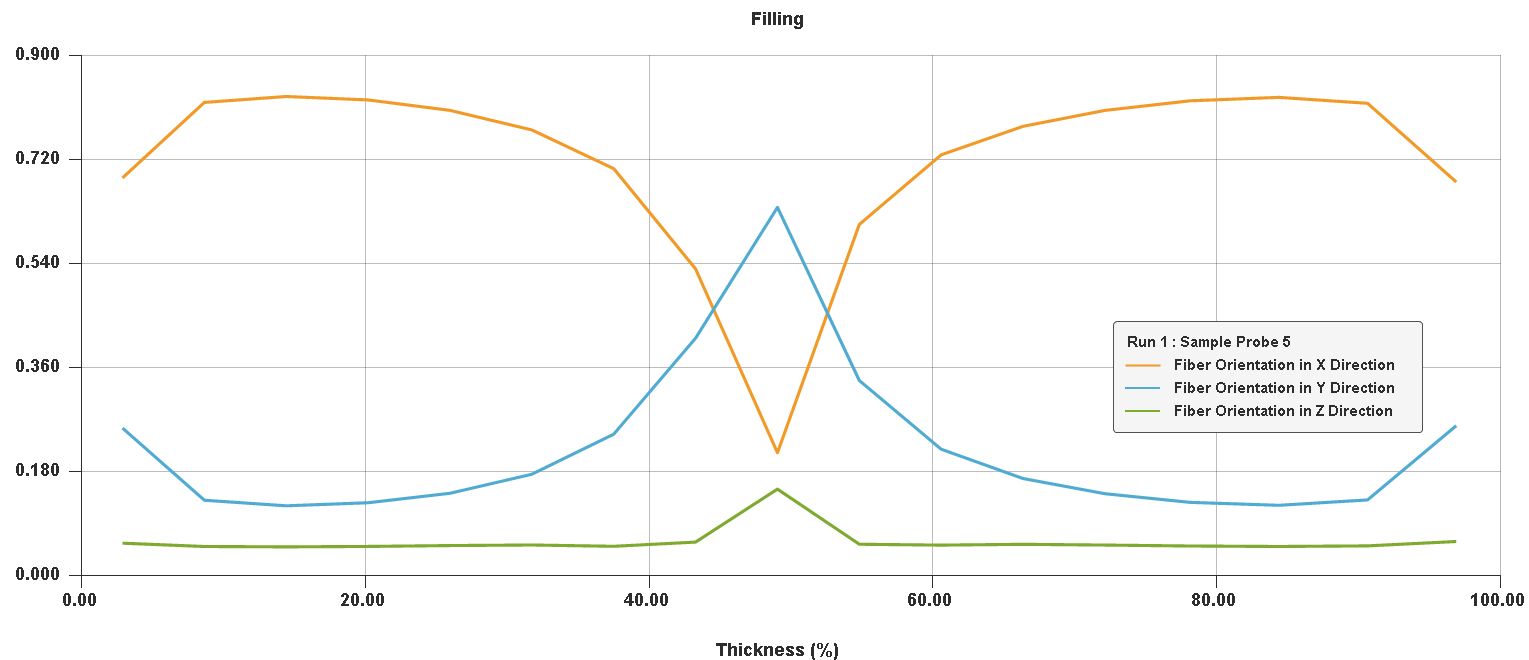
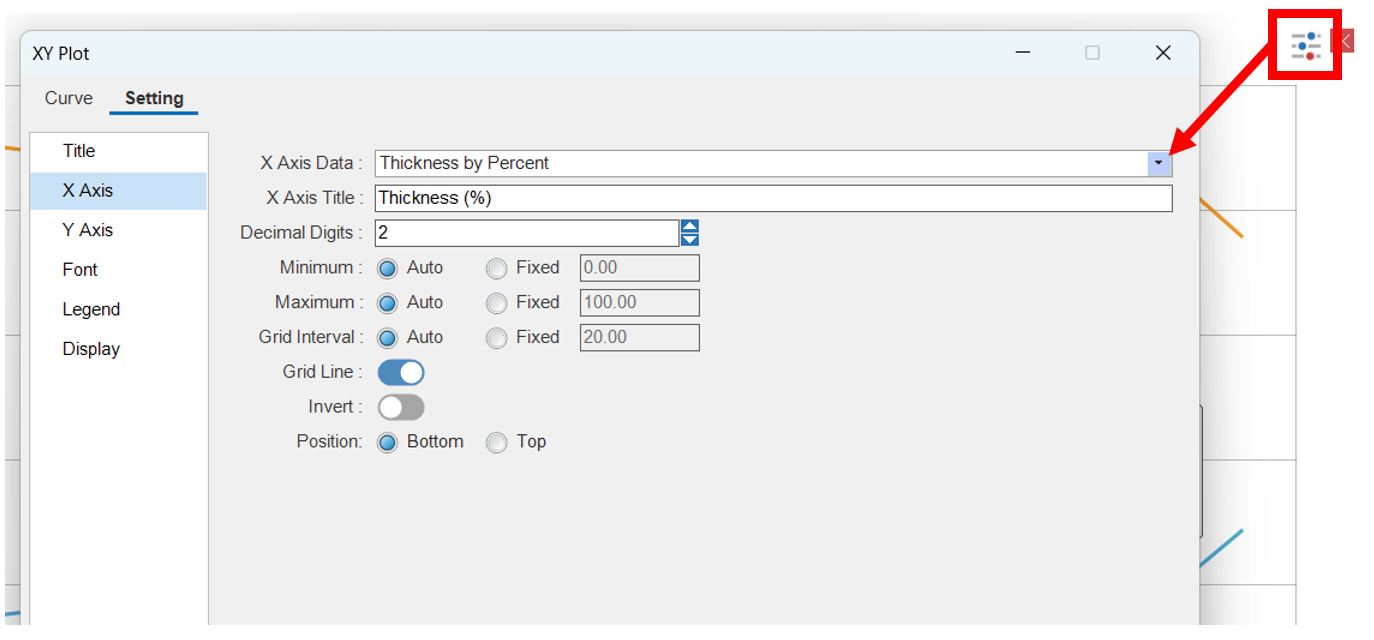
In addition, the plot setting can switch the X-axis between the percentage of thickness and the thickness in millimeters.