
RE: Plotting the fiber orientation distribution
Hello everyone,
I have simulated fiber orientation in Moldex3D and now I would like to export the fiber orientation data of a single slice. I’m particularly interested in obtaining a plot similar to the one shown in the Moldex3D promotional materials (see below). Alternatively, a representation with a normalized x-axis—as described in articles by Huan-Chang Tseng and colleagues—would also be ideal.
I have searched through the documentation and forums but couldn’t find clear instructions on how to extract this specific plot. For reference, I’m using Moldex3D version 2023.
Any help or pointers on how to achieve this export would be greatly appreciated.
Thank you in advance!
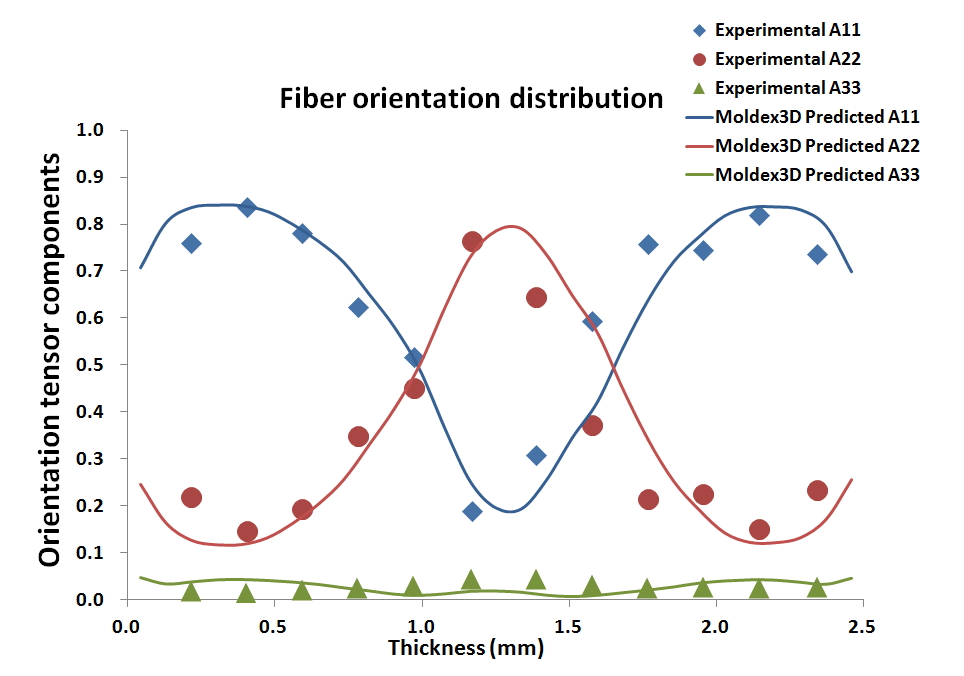 Fiber orientation plot from: https://www.moldex3d.com/wp-content/uploads/2017/03/Fiber005.jpg

Hi Marcus,
Thank you very much for your response!
I have one follow-up question regarding the probe:
To generate the plot, I understand that I need to place a sample point (probe) on the surface of the mesh. The plot then represents fiber orientation in relation to the thickness of the object.
My question is: When I place a single sample point, how far does its sphere of influence extend in the x and y directions? Or does it act as a vertical line downward, meaning that only elements directly intersected by this line contribute to the plot?
I appreciate your help—thanks in advance!


